Showing posts with label Medical Imaging. Show all posts

Sunday, 10 July 2011

MEDICAL IMAGE DATABASES

Wednesday, 23 February 2011

CARDIOMYOPATHY MRI

This video shows various magnetic resonance images of cardiomyopathy.

WORKING OF MAGNETIC RESONANCE IMAGING SCANNER - VIDEOS

These videos explains the working of MRI Scanner.


ANATOMY,PHYSIOLOGY TERMS USED IN CARDIAC MAGNETIC RESONANCE

AA - Ascending Aorta
AAA - Abdominal Aortic Aneursym
ABG - Arterial Blood Gas
AF - Arterial Fibrillation
AI - Aorta Insufficiency
AM - Acute Myocarditis
AO - AOrta
AoCo - Aortic Coarctation
AP - Anterio-Posterior
ALCAPA - Anomalous Left Coronary Artery of Pulmonary Artery
APVR - Anomalous Pulmonary Venous Return
AR - Aortic Regurgitation
ARVC - Arrhythmogenic Right Ventricular Cardiomyopathy
ARVD - Arrhythmogenic Right Ventricular Dysplasia
AS - Aortic Stenosis
ASD - Aterial Septal Defect
ASL - Antero Superior Leaflet
ASO - Arterial Stitch Operation
AV - Atrio Ventricular
AVB - AV Block
AVC - AV Connection
AVM - Aterio Venous Malfunction
AVSD - AV Septal Defect
Azy - Azygous Vein
BB - Black Blood
BBB - Bundle Branch Block
BCPC - Bidirectional Cavo Pulmonary Communication
BCV - Brancho Cephalic Vein
BP - Blood Pressure
BOLD - Blood Oxygenation Level Dependent
bpm - Beats per Minute
BT Shunt - Blalock Taussig Shunt (Blalock Thomas Taussig Shunt)
CA - Cavernous Angiomas
CABG - Coronary Artery Bypass Grafting
CAD - Coronary Atery Disease
CCTGA - Congenitally Corrected Transposition of Great Arteries
CFR - Coronary flow Reserve
CHF - Coronary Heart Failure
CT - Circulation Time, Capillary Telangiectasias
CO - Cardiac Output
CoA - Coarctation
DA / DAo - Descending Aorta
DAF - Dural Artero Venous Fistula
DCCF - Direct Carotid Cavernous Fistula
DCM - Dilated Cardio Myopathy
DIAG - Diagnosis
DILV - Double Inlet Left Ventricle
DKS - Damus Kaye Stansel
DobE - Dobutamine Echocardiography
DORV - Double Outlet Right Ventricle
DSE - Dobutamine Stress Echo-Cardiography
DSMR - Dobutamine Stress Magnetic Resonance
ECG - Electro Cardio Graphy
ECD - Endo Cardial Cushion Defect
EDV - End Diastolic Volume
EF - Ejection Fraction
ESV - End Systolic Volume
FF - Forward Flow
GA - General Anaesthesia
Gd - Gadolinium
HARP - HARmonic Phase Image
HCM - Hyper-Trophic Cardiomyopathy
HLA - Horizontal Long Axis
HOCM - Hypertrophic Obstructive Cardiomyopathy
HR - Heart Rate
HTN - Hyper TensioN
IAD - Inter Arterial Defect
IBL - Inferior Briding Leaflet
IE - Infectious Endocarditis
IHD - Ischemic Heart Disease
IM - Intra Muscular
IMH - Intra Mural Hematoma
IA - Innominate Artery
IV - Innominate Vein
IVC - Inferior Vena Cava


JVD - Jagular Venous Distension
LA - Left Atrium, Long Axis
LAA - Left Atrial Appendage
LAD - Left Anterior Descending Artery
LBL - Left Bridging Leaflet
LCA - Left Coronary Artery
LCC - Left Common Carotid Artery
LCX - Left Circumflex Artery
LIL - Left Inferior Leaflet
LLL - Left Lateral Leaflet
LLPA - Left Lower Pulmonary Artery
LLPV - Left Lower Pulmonary Vein
LMCA - Left Main Coronary Artery
LML - Left Mural Leaflet
LMS - Left Main Stem
LPA - Left Pulmonary Artery
LPV - Left Pulmonary Vein
LSL - Left Superior Leaflet
LV - Left Ventricle
LVD - Left Ventricular Dysfunction
LVNC - Left Ventroicular Non-Compaction
LVOT - Left Ventricular Outflow Tract
LVOTO - LVOT Obstruction
LVSV - Left Ventricular Stroke Volume
MAPCA - Major Aorto Pulmonary Collateral Arteries
MBF -Myocardial Blood Flow
MI - Myocardial Infarction
MPA - Main Pulmonary Artery
MR - Mitral Regurgitation
MV - Mitral Valve
MVP - Mitral Valve Prolapse
NSR - Non Sinus Rhythm
PA - Pulmonary Artery
PAA - Proximal Ascending Aorta
PAD - Peripheral Arterial Disease
PAPVR - Partial Anomalous Pulmonary Venous Return
PAU - Penetrating Atherosclerotic Ulcer
PCTA / PTA - Percutaneous Transluminal Angioplasty
PDA - Proximal Descending Aorta
PDA - Patent Ductus Ateriosus
PICA - Posterio Inferior Cerebral Artery
PFR - Peak Filling Rate
PLE - Protein Losing Entropathy
PM - Papillary Muscles
PPC - Peri Partum Cardiomyopathy
PPVI - Percutaneous Pulmonary Valve Implant
PR - Pulmonary Regurgitation
PS - Pulmonary Stenosis
PT - Pulmonary Trunk
PVD - Peripheral Vascular Disease
PVR - Pulmonary Vascular Resistance
Qp - Pulmonary Flow
Qs - Systematic Flow
RA - Right Atrium
RAA - RA Appendage
RAH - Right Atrium Hypertrophy
RBBB - right Bundle Block
RCA - Right Coronary Artery
RF - Regurgitant Flow
RHD - Rheumatic Heart Disease
RIL - Right Inferior Leaflet
RIPV - Right Inferior Pulmonary Vein
RLL - Right Lateral Leaflet
RLPV - Right Lower Pulmonary Vein
ROMI - Rule Out Myocardial Infarction
RPA - Right Pulmonary Artery
R-R - Time between successive R peaks in ECG wave
RSL - Right Superior Leaflet
RV - Right Ventricle
RVH - Right Ventricular Hypertrophy
RVOT - Right Ventricular Outflow Tract
RVOTO - RVOT Obstruction
RVSV - RV Stroke Volume
SA - Sino Atrial, Saccular Aneurysms, Short Axiz
SAM - Systolic Anterior Motion
SBL - Superior Bridging Leaflet
SCD - Sudden Cardiac Death
SEMI - Sub Endocardial Myocardial Infarction
SMA - Superior Mesentric Artery
SV - Stroke Volume
SVC - Superior Vena Cava
SVR - systemic Vascular Resistance
SVT - Supra Ventricular Tachycardia
TAPVD - Total Anamalous Pulmonary Venous Drainage
TAPVR - Total Anamalous Pulmonary Venous Return
TCPC - Total Cavo Pulmonary connection
TIA - Transient Ischemic Attack
TEA - Thrombo Endo Arterectomy
TEE - Trans Esophageal Echocardiography
Tet / TOF - Tetralogy of Fallot
TGA - Transposition of Great Arteries
TIMI - Thrombolysis in Myocardial Infarction
TMMI - Trans Mural Myocardial Infarction
TOS - Thoracic Outlet Syndrome
TTE - Trans Thoracic Echo Cardiography
VA - Venous Angiomas
VCG - Vector ECG
VCATS - Volume Coronary Angiography with Targeted Scans
VD - Venous Dysplasia
VF - Ventricular Fibrillation
VLA - Vertical Long Axis
VPS - View Per Segment
VSD - Ventricular Septal Defect
WMSI - Wall motion Score Index

Thursday, 22 July 2010

IMAGE DATABASES INCLUDING BIOMEDICAL IMAGES


Monday, 19 April 2010

MAGNETIC RESONANCE STUDY MATERIALS

The study materials to get knowledge of magnetic resonance imaging are given below :

1.) Nuclear magnetic resonance - Introduction

2.) Principles of Nuclear spin and Magnetic resonance

3.) RF Pulses

4.) Principles of K-space & Magnetic gradients

5.) Spin & Gradient Echos

6.) Two Dimensional Imaging & Selection of slices for imaging 

Friday, 26 March 2010

BIOMEDICAL PROJECTS - MEDICAL IMAGING / BIOMEDICAL IMAGE PROCESSING

MEDICAL IMAGING PROJECTS

MR Imaging

1.) Hyperpolarized Gas Polarimetry and Imaging at Low Magnetic Field
2.) Development of a Low-Field 3He MRI System to Study Posture-Dependence of Pulmonary Function
3.) Non-invasive assessment of regional ventilation in the human lung using oxygen-enhanced magnetic resonance imaging
4.) Spline Based Deformable Registration of MR Images
5.) A Complete Digital Magnetic Resonance Imaging (MRI) System at Low Magnetic Field (0.1 Tesla)
6.) NMR Hardware and Desktop Systems
7.) 3D Variational Brain Tumor Segmentation using a High Dimensional Feature Set
8.) 3D Visualisation of MRI images using MATLAB
9.) Contour Profiling of Brain Tumor Areas by Using Image Correlation and Peak Detection Techniques
10.) Automatic Detection & volume Determination Of Metastatic Brain Tumors
11.) Processing of visual stimuli in the brain: Investigations using simultaneous functional magnetic resonance imaging and electrophysiological recording.
12.) Efficient Multi-Modal Least-Squares Alignment of Medical Images Using Quasi-Orientation Maps
13.) Uniformity Correct ion with Homomorphic Filtering on Region of interest in MR imaging
14.) Quantification of Small Cerebral Ventricular Volume Changes in Treated Growth Hormone Patients Using Nonrigid Registration
15.) DEVELOPMENT OF ULTRA LOW-FIELD MAGNETIC RESONANCE IMAGING SYSTEM
16.) Ultra High Field MRI Whole-Slice and Localized RF Field Excitations Using the Same RF Transmit Array
17.) A MEDICAL IMAGE ENHANCEMENT ALGORITHM BASED ON TOPOLOGICAL DERIVATIVE AND ANISOTROPIC DIFFUSION
18.) Using MATLAB to Produce 3D Models, Segment CT and MRI Data, and Investigate Properties of Anatomical Volumes


CT / X-RAY IMAGING

1.) Registration of 3D angiographic and X-ray images using Sequential Monte Carlo sampling
2.) Three-dimensional Representation of the Human Arterial Tree
3.) Direct-Conversion Flat-Panel X-Ray Image Sensors for Digital Radiography
4.) Tumor Detection in the Bladder Wall with a Measurement of Abnormal Thickness in CT Scans
5.) Non-rigid registration methods assessment of 3D CT images for head- neck radiotherapy
6.) Computer-Aided Detection of Kidney Tumor on Abdominal Computed Tomography Scans
7.) Pulmonary nodule detection using chest CT images
8.) Computer aided diagnosis system for lung cancer based on helical CT images
9.) Contrast enhancement of soft tissues in Computed Tomography images
10.) Blind deblurring of CT images

BREAST IMAGING

1.) Breast Surface Estimation for Radar-Based microwave Breast Imaging Systems
2.) Estimating the breast surface using UWB microwave monostatic backscatter measurements
3.) Computer aided diagnostic systems for digital mammograms
4.) A combined system for detecting masses in mammographic images
5.) Detection of Breast Lesions in Medical Digital Imaging Using Neural Networks
6.) Computerized classification of suspicious regions in chest radiographs using subregion hotelling observers
7.) Computer Aided Diagnosis in Digital Mammograms: Detection of Micro-calcifications by Meta Heuristic Algorithms
8.) Analysis of Mammographic Micro-Calcifications Using Grey-Level Image Structure Features.
9.) Analysis of Asymmetry Mammograms via Directional Filtering With Gabor Wavelets
10.) Automatic identification of pectoral muscles in mammograms
11.) A fuzzy – genetic approach to breast cancer diagnosis
12.) Mammogram Image Size Reduction Using 16-8 bit Conversion Technique
13.) A Reconstruction Algorithm for Breast Cancer Imaging With Electrical Impedance Tomography in Mammography Geometry
14.) Measurement of Patient Exposure Dose on X-Ray Screening Mammography


Cardiac Imaging

1.) Multiresolution Approach for Non-Contact Measurements of Arterial Pulse using Thermal Imaging
2.) Automatic View Recognition for Cardiac Ultrasound Images
3.) Methods for Evaluating Left Ventricular Function Computed from ECG-Gated myocardial Perfusion SPECT

CELL IMAGING

1.) Cell Detections and Tracking Based on Bayesian Estimation Techniques in Biotechniques
2.) Early detection of lung cancer using 3D cell – CT
3.) Blur elimination of cell images with soft X-ray projection CT microscope
4.) An Image Mining Approach for Measuring Intensity, Size and Geographical localization of Stained Bodies in Cultured Cells: Application in Apoptosis Detection

IMAGE COMPRESSION & TRANSMISSION

1.) Efficient Image Compression of Medical Images Using the Wavelet
Transform and Fuzzy c-means Clustering on Regions of Interest.
2.) Compression of Medical Image Stacks using Wavelets and Zero-Tree Coding
3.) PARALLELIZATION OF HYPERSPECTRAL IMAGING CLASSIFICATION AND DIMENSIONALITY REDUCTION ALGORITHMS


Neuro-Imaging

1.) A feature-based approach to combine functional MRI, structural MRI and EEG brain imaging data
2.) A Method for Multi-Task FMRI Data Fusion Applied to Schizophrenia
3.) Analysis of FMRI Data by Blind Separation Into Independent Spatial Components
4.) Application of Independent Component Analysis to Magnetic Resonance Imaging for Enhancing the Contrast of Gray and White Matter
5.) Non-invasive Imaging of Cerebral Activation with Diffuse Optical Tomography


ELECTRICAL IMPEDANCE TOMOGRAPHY

1.) Electrical impedance tomography imaging using a priori ultrasound data
2.) Design of a modular adaptive Electrical impedance tomography system
3.) Image Reconstruction Methods for Electrical Impedance Tomography (EIT) on SUT-1 system
4.) 3-D Electrical Impedance Tomography of the human thorax
5.) A 32-electrode data collection system for Electrical Impedance Tomography
6.) Weighted Regularisation in Electrical Impedance Tomography with Applications to Acute Cerebral Stroke
7.) Kalman Filter Approach to track fast impedance changes in Electrical Impedance Tomography
8.) Regularized Reconstruction in Electrical Impedance Tomography using a variance Uniformization constant
9.) Krylov subspace Iterative techniques: On the Detection of brain activity with Electrical Impedance Tomography


EYE IMAGING

1.) Automatic diagnosis of diabetic retinopathy using fundus images
2.) Automated depth analysis of optic nerve head from stereo fundus images
3.) Digital Stereo Image Analyzer for Generating Automated 3-D Measures of Optic Disc
Deformation in Glaucoma
4.) Digital stereo-optic disc image analyzer for monitoring progression of glaucoma
5.) Design of an Automated Glaucoma Diagnostic System
6.) Automated method for fundus image registration and analysis
7.) Automatic 3D-Reconstruction of the Ocular Fundus from Stereo Images (3-d digital surface recovery of the optic nerve head from stereo fundus images)
8.) Retinal Vessel Extraction Using Multiscale Matched Filters, Confidence and Edge Measures
9.) Rapid automated tracing and feature extraction from live high-resolution retinal fundus images using direct exploratory algorithms
10.) Retinal thickness measurements from optical coherence tomography using a markov boundary model
11.) In vivo human retinal imaging by Fourier domain optical coherence tomography
12.) In vivo high-resolution video-rate spectral-domain optical coherence tomography of the human retina and optic nerve
13.) Early Detection on the Condition of Pancreas Organ as the Cause of Diabetes Mellitus by Real Time Iris Image Processing
14.) Segmentation of Medical Images using Fuzzy Mathematical Morphology
15.) Segmentation of Retinal Vasculature Using Wavelets and Supervised Classification
16.) High-Resolution In Vivo Imaging of the RPE Mosaic in Eyes with Retinal Disease
17.) In-vivo imaging of the photoreceptor mosaic in retinal dystrophies and correlations with visual function

THERMOGRAPHY IMAGING

1.) Forehead Thermal Signature Extraction in Lie Detection
2.) A Novel Approach for a Non-Invasive Diagnostic Technique of thyroid glands using thermographic systems
3.) A Correction Method of Medical Thermography's Distortion
4.) Application of Thermography for Non-Invasive Diagnosis of Thyroid Gland Disease
5.) Infrared thermography in the detection and management of coronary artery disease
6.) Automatic Feature Localization in Thermal Images for Facial Expression
Recognition
7.) ESTIMATION OF CORONARY BLOOD FLOW BY CARDIAC THERMOGRAPHY
IN OPEN CHEST CONDITIONS
8.) Non-contact, Wavelet-based Measurement of Vital Signs using Thermal Imaging
9.) PROCESSING THERMAL IMAGES TO DETECT BREAST CANCER AND ASSESS PAIN / EARLY BREAST CANCER DETECTION USING INFRARED IMAGING
10.) Thermal Image Analysis
for Polygraph Testing
11.) Thermal monitoring of the myocardium under blood arrest
12.) Multiresolution Approach for Non-Contact Measurements of Arterial Pulse using Thermal Imaging


US IMAGING

1.) Quantification of Thyroid Volume using 3-D ultrasound imaging
2.) Denoising images with wavelets: Modelling the backscatter noise in ultrasound images of tendons in limbs
3.) Parallel Computing in Time-Frequency Distributions for Doppler Ultrasound Blood Flow Instrumentation
4.) Identification of Vulnerable Atherosclerotic Plaque Using IVUS-Based Thermal Strain
Imaging
5.) Automatic boundary identification in ultrasound images of the prostate
6.) SPECKLE DETECTION IN ULTRASOUND IMAGES USING FIRST ORDER STATISTICS
7.) Ultrasound Image Segmentation by Using Wavelet Transform and Self-
Organizing Neural Network
8.) Breast Cancer Diagnosis Using Self-Organizing Map For Sonography
9.) Speckle Reduction in Ultrasonic Images of Atherosclerotic Carotid Plaque
10.) Fuzzy Neural Network Computer Assisted Characterization of Diffused Liver Diseases Using Image Texture Techniques on Ultrasonic Images
11.) Nonlinear analysis of carotid artery echographic images
12.) OVARIAN ULTRASOUND IMAGE ENHANCEMENT BY PSEUDOCOLORING
13.) SEGMENTATION OF PROSTATE CONTOURS FROM ULTRASOUND IMAGES

Monday, 30 November 2009

Biomedical Image Awards

The Biomedical Image Awards 2006 is a striking display of shapes and patterns, and illustrates the microscopic structures of living organisms in a spectacular variety of ways.

View the gallery of Biomedical images.

Friday, 27 November 2009

Low Dose CT

Computed Tomography technology has revolutionized medicine in the last decade as it can provide cross-sectional snapshots deep inside someone's body with unprecedented clarity. These images help doctors diagnose unseen illnesses and injuries, and they guide treatment for millions of people per year around the world. Yet for years, its imaging power has been constrained by the need to limit the radiation dose delivered to patients. In order to lessen concerns over radiation and open the door into new areas, even lower dose techniques have been developed.

High Definition & Low Dose Computed Tomography
The development of the world’s first high-definition CT scanner is one of the technological innovations in imaging that will revolutionize the way doctors view CT image clarity and capability for their patients. Building upon the natural properties of a garnet gemstone, scientists at GE have created the first new CT scintillator material in 20 years — making the world’s first HDCT scanner — the Discovery™ CT750 HD — possible. This CT scanner marks the next generation of CT imaging that delivers better image clarity at faster detector speeds than ever before and with the ASiR™* dose reduction technology to significantly reduce X-ray dose. Moreover, Gemstone™ Spectral Imaging is a revolutionary advanced imaging application that is exclusive to the Discovery CT750 HD. With this technology, clinicians and doctors are able to confidently diagnose disease delivering world-class patient care. (*Adaptive Statistical Iterative Reconstruction).

Click here to know the scientists behind.
Click here to know the details of  Discovery CT750 HD.

Healthy dose of freedom with ASiR™: High Image Quality and Low Dose

Today, thanks to innovation ASiR technology from GE, clinicians have the freedom to lower patient dose dramatically without compromising image quality. ASiR technology is especially beneficial in higher risk populations, such as children and young women, in whom the greater sensitivity of growing tissues makes strict dose limitation a real necessity. Based on wide experience in patients scanned with ASiR, GE customers can attest to consistently high image quality with low dose levels throughout the entire CT product range.

View video: Dose less is more
Low Dose CT: Learn more
Low Dose CT: healthymagination Factsheet
View video: ASiR- Ease of Use 
Discovery CT750HD: Clinical Cases
LightSpeed™ VCT XTe: New clinical dimensions 
BrightSpeed™ Elite with ASiR: Small Giant

Integrating Dose Reduction techniques across Clinical Education Curriculum

GE Healthcare’s CT Clinical Education team is integrating Dose reduction techniques across its range of different customer training offerings. This starts right from the initial on-site applications visit through to the various customer support re-visits. During these sessions the CT Clinical Education Specialist will work with the customer to optimise their protocols using the latest ASiR technology where appropriate to achieve the highest level of Image Quality possible at the lowest achievable dose. Dose Reduction is fast becoming one of the key modules within the Classroom based and Doctor-to-Doctor offerings targeting the educational needs of both the Radiographers and Radiologists/Cardiologists.

Click here to know about training education.

Sunday, 1 November 2009

MEDICAL IMAGE FILE FORMATS

ACR-NEMA 2.0 :Standard from NEMA, predating DICOM
AFNI : AFNI Native Format
Analyze: Image file format from Mayo Foundation
BMP : Windows BMP File Format
Bruker : Bruker Paravision
DICOM : The DICOM 3 standard
ECAT 6 : CTI CT Format
ECAT 7 : CTI CT/PET Format
GE ADVANCE : GE ADVANCE PET
GE MRI Genesis 5 : GE MRI format
GE MRI LX
GE MRI Signa 3, 4 : GE format for MRI
GE Scanditronix : GE 4096 PET Format
Gif : Graphic Image Format
GIPL : Guys Image Processing Lab
Interfile 3.3 : Nuclear medicine file format
JPEG
LONI
Matlab
Minc : Multimodality format from MNI
NetCDF : Array-oriented format from NCAR
NIFTI : Analyze-derived FMRI format
Own/Unique : File format unique to one program.
Papyrus : DICOM compatible file format
PGM : Portable Greymap Format
Picker : CT Old CT/MRI format
PICT : Apple graphic file format
PNG : Portable Network Graphics
PPM : Portable Pixmap File Format
QuickTime : QuickTime
Raw : Image file with no header
Siemens Somatom : Siemens CT format
SPM : SPM (Analyze 7.5 variant)
TIFF : Tag Image File Format
VTK : Visualization Toolkit format
XIF

Free medical imaging softwares, applications and resources


If you work with medical imaging files, the site "I DO IMAGING" can help you. Looking for a free DICOM viewer, DICOM converter, or PACS client? You'll find them there.It tracks free medical imaging applications and resources: conversion programs, image display and analysis, surface and volume rendering, PACS clients and servers. Many programs are classified by a speciality to allow you to find similar programs by imaging modality, medical specialization, or similar. Half of all the programs listed there work with DICOM files, but there are over 25 file formats covered.

All the programs included are free and intended for distribution; there are no "demo" versions of commercial applications. If you are involved in programming, many of the programs are open-source, and provide APIs and SDKs for radiology programmers.

Medical Imaging : DICOM Standard

DICOM which stands for " Digital Imaging and Communication in Medicine " is a document which defines a method of communication for the various equipment of digital medical imaging devices/softwares. This standard is now in use by the majority of medical imagering hardware manufacturers. It represents a progress in that it makes it possible to predict the interconnection of various imaging modalities, through a Document of Conformity emitted for each machine/software following this standard. Thus, the standard makes it possible for the equipment to communicate remotely through a network or a media (disk or tapes ). By ensuring the compatibility of the equipment and by eliminating proprietary formats.

The goal is to obtain the images of the patient and all epidemiological information associated with, in an identical format allowing the interconnection and the interaction of the equipments and the transfer of the data.

WHY DICOM FORMAT FOR MEDICAL IMAGES?

1.) Single Identification Of the Produced Images:

A Department of Radiology produces several thousands of images every day, thus, a CT Scanner, working at the rate of 3 examinations per hour produces approximately 150 images per hour, and it is not possible to classify these images in a JPEG or GIF format because it would have a risk of losses of the demographic data of the images, (name of the patient, type of examination, hospital, date of examination, type of acquisition etc...). The DICOM Standard allows to make each produced image single and to associate specific information to them. Thus each image is autonomous, if it is lost, reproduced or re-elected, it is always possible to identify formally its origin, the patient, the date, the series from where it comes, parameters of acquisition etc..

The format is not rigid, it contains obligatory informations and other optional ones. Several single identification numbers UID (" Unique IDentifiers " ) are automatically generated by DICOM modalities and mandatory in each DICOM file or transfer. It cannot exist two identical UID that indicates different information, for example the machine and its localization, the UID of a series of images which is specific to a date, a patient, a study, a hospital and a given machine. This identification is necessary not only for medical and medico-legal reasons, but also to allow the devices for the formation and the management of hospital or imaging databases.

4 mandatory UID's for each DICOM image:

i.) Sop Class Uid  
Identify the type of Service for which the image is intended .
Storage Class Service
Query/Retrieve Class Service.

ii.)Study Authority Uid 
Identify a whole examination, in time and place.

iii.)Series Authority Uid 
Identify a series of images within the examination.

iv.)SOP Authority UID or Image UID 
Identify the image associated with the file

2.) The format is independent of the machines and the communications protocols:

Standard DICOM is used at the applicatif " level " i.e. it allows the communication of a programe another, this imply that connect them of low level, cablages and protocols networks are drawn up.

3.) the format uses a controlled vocabulary:

It is significant that from one machine to another the vocabulary either identical thus, one identifies the data in a universal way the some or machine. DICOM uses standard SNOMED developed by the anatomo-pathologists (Systemized Nomenclature for Medicine).

4.) the standard can be easily revised and modified thanks to the multiplicity of the Reference documents.

Currently standard DICOM 3 is composed of 12 parts to which are added supplements. The drafting of this standard follows strict directives established by the ISO committee.

5.) Format DICOM is adaptable to the different medical specialities :

Thus this format is already adopted by the cardiologists, the dentists, the anatomopathologists and the gastro-enterologists.

UNIVERSALITY OF DICOM

The old equipment often not to standard DICOM. Currently the numerical systems should be completely conforming DICOM, actually the majority of the equipment are it only partially and it is the responsibility for the user to buy open Dicom systems i.e.
i.)connectables by a network TCP/IP Ethernet
ii.)and/or being able to leave information in the form a media numerical (CD Rom, Zip discs, optical discs erasable...).

Indeed two conforming machines DICOM can not be very well connectables for reasons of physical wiring or protocols different networks.

ORGANIZATIONS RESPONSIBLE FOR DICOM

Standard DICOM was emitted by the ACR (American College of Radiology) in partnership with the NEMA (National Electrical Manufacturers Association), it is currently updated by these 2 committees to which joined different committees of international experts the such JRIA Japan, the ANSI in the USA, the CENTC251 in Europe.

The ACR is responsible for the technical and medical instructions, the NEMA is responsible for the publications and the legal problems, to avoid conflicts of interests or a possible infringement with the antitrust loies.

These committees do not have economic interests, one will note that this standard is defined out of France, in English language with the difficulties of translation of a precise technical language.

Monday, 26 October 2009

MOBILE DIGITAL MAMMOGRAPHY SYSTEMS


 If women do not come to screening – then screening must come to them. This was GE’s ethic for this project. In this way, itreached to overcome the barrier of physical distance and encourage women to attend breast screening. This proximity helps a lot of screening organizations to increase their attendancy rates and thus to reduce breast cancer mortality.

Friday, 23 October 2009

LIST OF ADVANCED MEDICAL VISUALIZATION SOFTWARES

1.) 3Di

3Di is a novel cloud computing platform for advanced (3D) visualization and analysis of medical images. With zero upfront cost, 3Di turns any internet PC to a full feature advanced visualization workstation - delivering both image data, visualization and analysis tools.


2.) 3Dnet Suite

3DNet Suite is a proven multi-purpose medical imaging application suite, which offers an extensive set of tools for clinical data analysis. It accepts DICOM compliant images from most aquisition devices. The complete imaging product family has multilingual support. The Suite is a totally interactive tool, designed for 2D and 3D reconstruction of small and large data.


3.) DynaCAD for Prostate

DynaCAD for Prostate is a digital imaging system with a comprehensive set of advanced visualization tools for performing real-time image analysis of prostate MRI studies.


4.) DynaSuite Neuro

DynaSuite Neuro - Automated Processing for Optimized Workflow DynaSuite Neuro is a high performance advanced MR neuro solution by Invivo, designed for optimal workflow and repeatable analysis for pediatrics and adults. The data is automatically processed and displayed in predefined layouts which are customizable for the physicians preference. The simplified user interface provides the neuroradiologist with the tools to analyze perfusion (PWI), diffusion (DWI) and functional MRI (fMRI) quickly and easily.


5.) FiatLux Visualize

FiatLux Visualize delivers the ability to interactively manipulate CT and MR patient data in real-time. Most PCs, laptops and tablets readily support the rich graphics delivered by FiatLux Visualize, allowing the ability to view images in the office, at home, or at the patient bedside.


6.) Multilayer3D PRO

Multilayer3D PRO is an advanced 3D GIS (Radar) visualization system for environmental and structural monitoring.


7.) PercuNav Software

The Traxtal PercuNav system represents a new class in Image Guided Intervention (IGI) equipment. It is the first FDA cleared IGI system to track the tips of needles. It seamlessly integrates preoperative with live images, showing the tool location superimposed on the images.


8.) Vision Tools 3Dview

Vision Tools 3Dview is a powerful and scalable MPR/MIP/3D reconstruction software for CT and MRI modalities that can present high quality 3D volumes with multiple color editing utilities.


9.) Vitrea Software

Vitrea Enterprise Suite is Vital Images’ premier package of advanced visualization tools, clinical applications and data management systems. These scalable solutions integrate seamlessly with PACS, and are available across your enterprise, via the Web, and on both thin- and thick-client technologies.


10.)Ziostation

Ziostation includes all the tools necessary to analyze case types from the basic to the advanced. The clinical applications are 3D, 4D, MIP, MPR, CPR, Multi-Modality Viewer, Multi-volume fusion, Vessel analysis, Coronary analysis, Colon analysis,PET/CT viewer, CT Cardiac Function Analysis, CT Brain Perfusion, Calcium Scoring, Reporting functions.

Saturday, 5 September 2009

INTERNSHIPS IN MATERIALISE GROUP

With its headquarters in Leuven, Belgium and branches all over the world, the Materialise Group is best known for its activities in the field of rapid industrial and medical prototyping. Apart from having the largest capacity of rapid prototyping equipment in Europe, Materialise enjoys a worldwide reputation as provider of innovative software solutions. As such, Materialise has acquired the position of market leader for 3D printing and Digital CAD software in addition to being a major player in medical and dental image processing and surgery simulation. Moreover, through its unique .MGX division for design products, Materialise is currently opening the market for customized Rapid Manufacturing. The customer base includes all large companies in the automotive, consumer electronics and consumables sectors. Its medical and dental products are used worldwide by famous hospitals, research institutes and clinicians. Unique design shops all over the world rely on Materialise.MGX. The group has several subsidiaries in Europe, Asia and the USA, and employs over 700 people.

Internships

Materialise is a high-tech company with a broad domain of expertise, ranging from Rapid Prototyping, Software engineering & development, innovative biomedical R&D & planning sofware, product design.

They are proud to offer students a hands-on experience in one of these areas during an internship within their company.

Click here to see the list of internships in Belgium.

Click here to see the list of internships in malaysia.

you can send in a spontaneous application for an internship via this link.


(BELGIUM)


(Malaysia)

Webcast - Vision Guided Robotics

Webcast Date: September 16, 2009

Who Should Attend:
Engineers and system integrators who are responsible for developing, designing, specifying, or reviewing applications involving robots and machine vision components and systems.

This Webcast - Vision-Guided Robotics - will provide engineers and system integrators with the basic information tools so that they can combine machine vision and robotics in their applications to meet manufacturing challenges. The focus will be on both components and on system design. It will include a brief view of the market drivers/opportunities and then focus on how to integrate vision and robotics, with lessons learned and specific case studies to illustrate the main points.

The webcast will highlight some of the problems, solutions, and typical applications of this technology:
i.)Using robots and vision: when is vision required?
ii.)What should the system integrator look for from software vendors?
iii.)Examples of a 2-D vision system used in conjunction with a robot
iv.)What image processing functions are required by 2-D systems?
v.)Descriptions of single-camera, dual-camera, time of flight, and laser scanner-based systems
vi.)The present challenges facing this technology and advanced technologies such as support vector machines, 3-D object recognition with CAD models, and multispectral analysis

Register Today!

More Information!

SPEAKER:

Adil Shafi
Vision and Robotics Expert
Advenovation


ADIL SHAFI has developed new and reliable solutions in the robotics and vision industry for over 20 years. These solutions run on automation equipment valued at more than $300 million. Recently he has been known for his development of advanced vision-guided robotic bin-picking applications. Shafi holds three degrees from Michigan Technological University and maintains extensive relationships in industry, academic, defense, and government circles. His personal goals are to foster innovation, help create jobs, and maintain economic vitality.

Wednesday, 4 March 2009

PACS COMPANIES


Picture Archiving and Communication System (PACS) is a key technology for the management or medical imaging and its associated data. As imaging has moved from hard copy to soft copy and increasing numbers of clinicians wish to access original image data rather simply review the "reads," PACS has become the key tool to tie together the diverse imaging modalities and clinical departments.

PACS is primarily an IT system that solves three problems:

i.)Storage of images and associated text data, usually via the DICOM standard
ii.)Retrieval of such data to both local and remote viewers via networking standards
iii.)Backup of data to comply with legal regulations. PACS provides the management tools to make this safe and secure.

PACS is not a set of protocols as each vendor provides different approaches to these same problems. The emergence of remote radiology and night hawk services that operate across the Internet suggest that IP (internet protocols) and the need for diverse institutions to work more closely together could start the process of imposing a set of articulated protocols and standards on the PACS industry.

The establishment of standards would be a substantial benefit for customers of PACS as such standards would reduce the costs of purchase and ownership, enable easy migration from one system to another, and reduce the costs of specification and purchase as buyers could simply require that vendors met standards rather than spell out for themselves desired components of those standards.

The list below represents the key PACS Companies that develop and sell PACS systems:

Agfa HealthCare
AMICAS, Inc.
Aspyra, Inc.
Acuo Technologies, LLC
American Medical Sales, Inc.
Avreo, Inc.
aycan Medical Systems, LLC
BRIT Systems, Inc.
Carestream Health, Inc.
Candelis, Inc.
Cerner Corporation
CHILI USA, Inc.
CoActiv Medical Business Solutions
Compressus, Inc.
Connect Imaging, Inc.
Data Distributing, LLC
DatCard Systems, Inc.
DeJarnette Research Systems, Inc.
Digisonics, Inc.
Double Black Imaging
DR Systems, Inc.
Emageon, Inc.
EMC Corporation
Empiric Systems, LLC
eRAD, Inc.
Evorad S.A
Graina Medical Solutions
Healthy-IT
IMCO Technologies
Impac Medical Systems, Inc.
Insignia Medical Systems
Intelerad Medical Systems
Integrated Molecular Systems, Inc.
Intuitive Imaging Informatics
INFINITT Co., Ltd.
MacPacs, Inc.
McKesson Corporation
Merge Healthcare
medavis GmbH
Medical Insight A/S
Medicatech USA
Medstrat, Inc.
Medweb
Meta Fusion
MillenSys
NovaRad Corporation
PACSGEAR
Philips Healthcare
Pro Medicus Limited
QStar Technologies, Inc.
RADinfo SYSTEMS
Radlink, Inc.
RamSoft, Inc.
RAYPAX, Inc.
Ray-Tek Services, Inc.
Reliant Medical Services, Inc.
RIS Concepts, Inc.
Rogan-Delft B.V
SMAART Medical Systems, Inc.
Sage Healthcare
ScImage, Inc.
Sectra
TeraRecon, Inc.
Sobha Renaissance Information Technology
Thinking Systems Corporation
Tobin Technical
T2 Technologies
VEPRO AG
VIDAR Systems Corporation
Visage Imaging, Inc.
Visbion Limited
Viztek, Inc.
Voyager Imaging

Tuesday, 22 January 2008

CONFOCAL LASER SCANNING MICROSCOPY


Confocal laser scanning microscopy (CLSM or LSCM) is a technique for obtaining high-resolution optical images. The key feature of confocal microscopy is its ability to produce in-focus images of thick specimens, a process known as optical sectioning. Images are acquired point-by-point and reconstructed with a computer, allowing three-dimensional reconstructions of topologically-complex objects.


DESCRIPTION

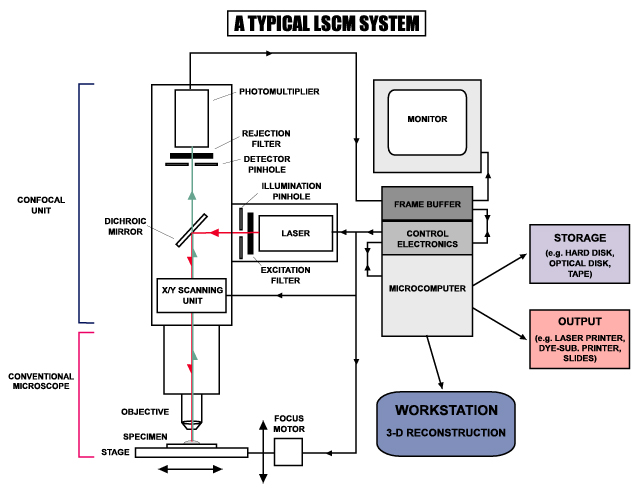
In a confocal laser scanning microscope, a laser beam passes through a light source aperture and then is focused by an objective lens into a small (ideally diffraction limited) focal volume within a fluorescent specimen. A mixture of emitted fluorescent light as well as reflected laser light from the illuminated spot is then recollected by the objective lens. A beam splitter separates the light mixture by allowing only the laser light to pass through and reflecting the fluorescent light into the detection apparatus. After passing a pinhole, the fluorescent light is detected by a photodetection device (a photomultiplier tube (PMT) or avalanche photodiode), transforming the light signal into an electrical one that is recorded by a computer.

The detector aperture obstructs the light that is not coming from the focal point, as shown by the dotted gray line in the image. The out-of-focus light is suppressed: most of their returning light is blocked by the pinhole, resulting in sharper images than those from conventional fluorescence microscopy techniques, and permits one to obtain images of various z axis planes (also known as z stacks) of the sample.


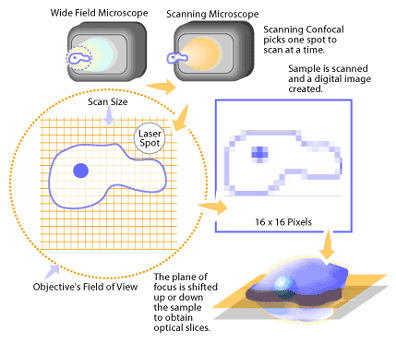
The detected light originating from an illuminated volume element within the specimen represents one pixel in the resulting image. As the laser scans over the plane of interest, a whole image is obtained pixel-by-pixel and line-by-line, whereas the brightness of a resulting image pixel corresponds to the relative intensity of detected fluorescent light. The beam is scanned across the sample in the horizontal plane by using one or more (servo controlled) oscillating mirrors. This scanning method usually has a low reaction latency and the scan speed can be varied. Slower scans provide a better signal-to-noise ratio, resulting in better contrast and higher resolution. Information can be collected from different focal planes by raising or lowering the microscope stage. The computer can generate a three-dimensional picture of a specimen by assembling a stack of these two-dimensional images from successive focal planes.


CONFOCAL IMAGE OF GFP FUSION PROTEIN


Confocal microscopy also provides a substantial improvement in lateral resolution and the capacity for direct, noninvasive, serial optical sectioning of intact, thick, living specimens with a minimum of sample preparation. Because CLSM depends on fluorescence, a sample usually needs to be treated with fluorescent dyes to make objects visible. However, the actual dye concentration can be low to minimize the disturbance of biological systems: some instruments can track single fluorescent molecules. Also, transgenic techniques can create organisms that produce their own fluorescent chimeric molecules (such as a fusion of GFP, green fluorescent protein with the protein of interest).

RESOLUTION OF IMAGES

CLSM is a scanning imaging technique in which the resolution obtained is best explained by comparing it with another scanning technique like that of the scanning electron microscope (SEM). Do not confuse CLSM with phonograph-like imaging—AFM or STM, for example, where the image is obtained by scanning with an atomic tip over a conducting surface.

In CLSM a fluorescent specimen is illuminated by a point laser source, and each volume element is associated with a discrete fluorescence intensity. Here, the size of the scanning volume is determined by the spot size (close to diffraction limit) of the optical system because the image of the scanning laser is not an infinitely small point but a three-dimensional diffraction pattern. The size of this diffraction pattern and the focal volume it defines is controlled by the numerical aperture of the system's objective lens and the wavelength of the laser used. This can be seen as the classical resolution limit of conventional optical microscopes using wide-field illumination. However, with confocal microscopy it is even possible to overcome this resolution limit of wide-field illuminating techniques because only light generated in a small volume element is detected at a given time. Here the effective volume of light generation is usually smaller than the volume of illumination; that is, the diffraction pattern of detectable light creation is sharper and smaller than the diffraction pattern of illumination. The resolution limit in confocal microscopy depends not only on the probability of illumination but also on the probability of creating enough detectable photons, so that the actual addressable volume being associated with a generated light intensity is smaller than the illuminated volume. Depending on the fluorescence properties of the used dyes, there is a more or less subtle improvement in lateral resolution compared to conventional microscopes. However, with light creation processes with much lower probabilities of occurrence such as second harmonic generation (SHG), the volume of addressing is reduced to a small region of highest laser illumination intensity, substantially improving lateral resolution. Unfortunately, the probability decrease in creation of detectable photons negatively affects the signal-to-noise ratio. One can compensate for this effect by using more sensitive photodetectors or by increasing the intensity of the illuminating laser point source. Increasing the intensity of illumination later risks excessive bleaching or other damage to the specimen of interest, especially for experiments in which comparison of fluorescence brightness is required.

BIOMEDICAL APPLICATIONS

1.)CLSM is widely-used in numerous biological science disciplines, from cell biology and genetics to microbiology and developmental biology.


(Organization of actin arrays in mitosis)

2.)Clinically, CLSM is used in the evaluation of various eye diseases, and is particularly useful for imaging, qualitative analysis, and quantification of endothelial cells of the cornea. It is used for localizing and identifying the presence of filamentary fungal elements in the corneal stroma in cases of keratomycosis, enabling rapid diagnosis and thereby early institution of definitive therapy.

3.)Research into CLSM techniques for endoscopic procedures is also showing promise.

4.)CLSM is also used as the data retrieval mechanism in some 3D optical data storage systems and

5.)It has helped determine the age of the Magdalen papyrus.

CONFOCAL MICROSCOPY

Confocal microscopy is an optical imaging technique used to increase micrograph contrast and/or to reconstruct three-dimensional images by using a spatial pinhole to eliminate out-of-focus light or flare in specimens that are thicker than the focal plane. This technique has been gaining popularity in the scientific and industrial communities. Typical applications include life sciences and semiconductor inspection.


Confocal microscopy enables the visualization and imaging of fixed as well as living cells and tissues that contain fluorescent probes (antibodies, green fluorescent proteins, dyes, substrates). This technique allows sharply defined optical sections to be collected, from which three dimensional rendering and movies can be created.


(Human cytomegalovirus infected human endothelial cells. Multicolor Immunofluorescence (IF). Blue: DAPI = cellular DNA. Green = GFP (green fluorescence protein). Red + Magenta = two different viral proteins. Captured with a Zeiss LSM510 laser scanning confocal microscope)

CONCEPT OF CONFOCAL MICROSCOPY


In a conventional fluorescence microscope, the entire specimen is flooded in light from a light source. Due to the conservation of light intensity transportation, all parts of the specimen throughout the optical path will be excited and the fluorescence detected by a photodetector or a camera. In contrast, a confocal microscope uses point illumination and a pinhole in an optically conjugate plane in front of the detector to eliminate out-of-focus information. Only the light within the focal plane can be detected, so the image quality is much better than that of wide-field images. As only one point is illuminated at a time in confocal microscopy, 2D or 3D imaging requires scanning over a regular raster (i.e. a rectangular pattern of parallel scanning lines) in the specimen. The thickness of the focal plane is defined mostly by the square of the numerical aperture of the objective lens, and also by the optical properties of the specimen and the ambient index of refraction.


TYPES OF CONFOCAL MICROSCOPES


1.)Confocal laser scanning microscopes


2.)Spinning-disk (Nipkow disk) confocal microscopes

BIOMEDICAL BOOKS

Join me on Facebook Follow me on Twitter Subscribe to RSS